• Skip to primary navigation
  • Skip to main content

Digital Gallatin

Connect. Create. Innovate.

  • Home
  • Start a Project
  • The How-To Blog
  • Tools
    • Annotation
    • Data Visualization
    • Design
    • Mapping
    • Storytelling
    • More Tools…
  • Featured Projects
  • Resources

Data Visualization

Venngage

April 15, 2021

Venngage interface

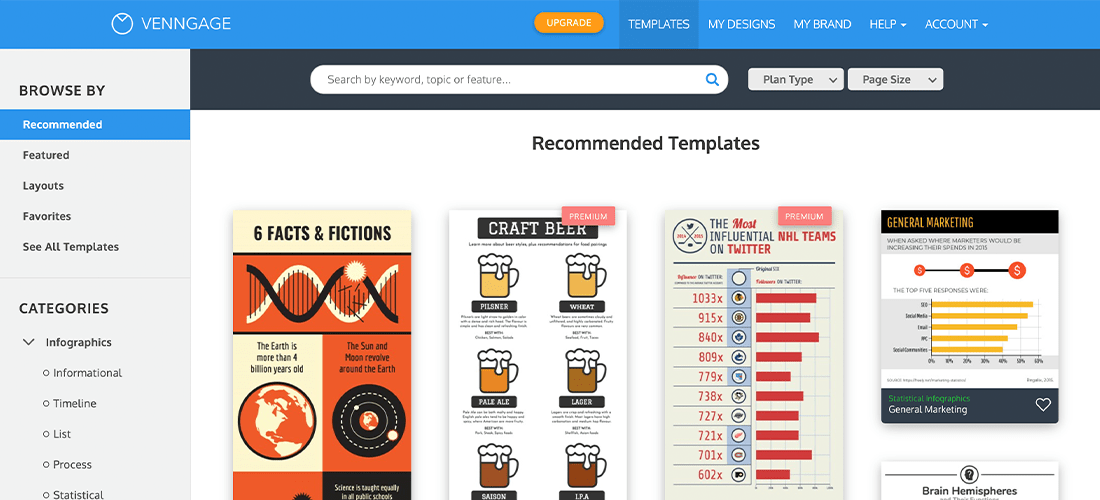
Venngage: This is a great tool for creating several different types of visual materials, such as infographics, presentations, reports, diagrams, and lesson plans. The tool has a variety of templates for you to choose from, and you’ll find the templates’ ease-of-use convenient when you want to build visuals in a short amount of time. Venngage is also cloud-based, so you can continue working on templates from any device. Create up to five free projects. FREE/PAID

  • Click to print (Opens in new window)
  • Click to share on Twitter (Opens in new window)

Filed Under: Data Visualization, Design, Ebooks, Infographics, Make & Build, Mind Maps, Presentation Platforms, Project Management, Writing Tagged With: Free/Paid

EdWordle

November 19, 2020

EdWordle: An online word cloud generator that allows you to create unique word clouds through using text and data that you provide the website for analysis. FREE.

  • Click to print (Opens in new window)
  • Click to share on Twitter (Opens in new window)

Filed Under: Data Visualization, Infographics Tagged With: Free

Zeppelin

August 7, 2018

Zeppelin: a web-based notebook with collaborative features that supports data ingestion, discovery, analytics, and visualization. Zeppelin works seamlessly with SQL, Python, and Spark, and allows plugins for any language/data-processing-backend. FREE.

  • Click to print (Opens in new window)
  • Click to share on Twitter (Opens in new window)

Filed Under: All Tools, Data Visualization Tagged With: Free

DataViz Project

July 30, 2018

DataViz Project: an online database of different forms of data visualization categorized by function, family, shape, and input format. Use it for inspiration when creating your own visualization. 

  • Click to print (Opens in new window)
  • Click to share on Twitter (Opens in new window)

Filed Under: All Tools, Data Visualization Tagged With: Free

OmniSci

March 21, 2018

OmniSci: as an open-source SQL engine, OmniSci is an analytics platform that creates visual representations of data to enhance analysis and interaction, including functionalities for multi-layered geospatial mapping. Explore their interactive demos, of which we highlight this live tweet map. Free/Paid.

  • Click to print (Opens in new window)
  • Click to share on Twitter (Opens in new window)

Filed Under: All Tools, Data Visualization, Mapping Tagged With: Free/Paid

Google’s Data Gif Maker

May 26, 2017

Google’s Data Gif Maker: a simple visualization tool that helps you illustrate a two-term data comparison in the form of a GIF. Simply add your terms and comma-separated values to the form in order to generate your downloadable GIF file. FREE.

  • Click to print (Opens in new window)
  • Click to share on Twitter (Opens in new window)

Filed Under: All Tools, Data Visualization Tagged With: Free

Google Trends

May 26, 2017

Google Trends: visualize search topics trending on Google and YouTube. The platform generates line graphs and maps to illustrate the frequency of searches for your selected term(s); you can limit the scope of your research by time, location, category and type of search. FREE.

  • Click to print (Opens in new window)
  • Click to share on Twitter (Opens in new window)

Filed Under: All Tools, Data Visualization Tagged With: Free

LeafletJS

May 10, 2017

LeafletJS: An open-source JavaScript library for mobile-friendly interactive maps. Leaflet does not provide data for you, but you can convert your data to GeoJSON and then make a Leaflet map. Though Leaflet is not a GIS, it can be combined with tools like CartoDB. Check out this tutorial to get started. FREE.

  • Click to print (Opens in new window)
  • Click to share on Twitter (Opens in new window)

Filed Under: All Tools, Data Visualization, Mapping Tagged With: Free

ArcGIS

May 10, 2017

ArcGIS: A system for working with maps and geographic information. Frequently used for making maps, analyzing mapped information and managing geographic information in a database. Add your maps to powerpoint, or create a StoryMap around spatial data (tutorial here). ArcGIS is accessible on the Data Services workstations (located within the Research Commons on the 5th floor of Bobst Library).

  • Click to print (Opens in new window)
  • Click to share on Twitter (Opens in new window)

Filed Under: All Tools, Data Visualization, Mapping Tagged With: Free/Paid

Carto

May 10, 2017

Carto: A platform that provides GIS and web mapping tools for display in a web browser, Carto is great if you want to map a dataset. NYU students, faculty, and researchers can get a Carto account when they sign up here with their NYU email. 

  • Click to print (Opens in new window)
  • Click to share on Twitter (Opens in new window)

Filed Under: All Tools, Data Visualization, Mapping Tagged With: Free/Paid

Next Page »

Copyright © 2025 · NYU Gallatin